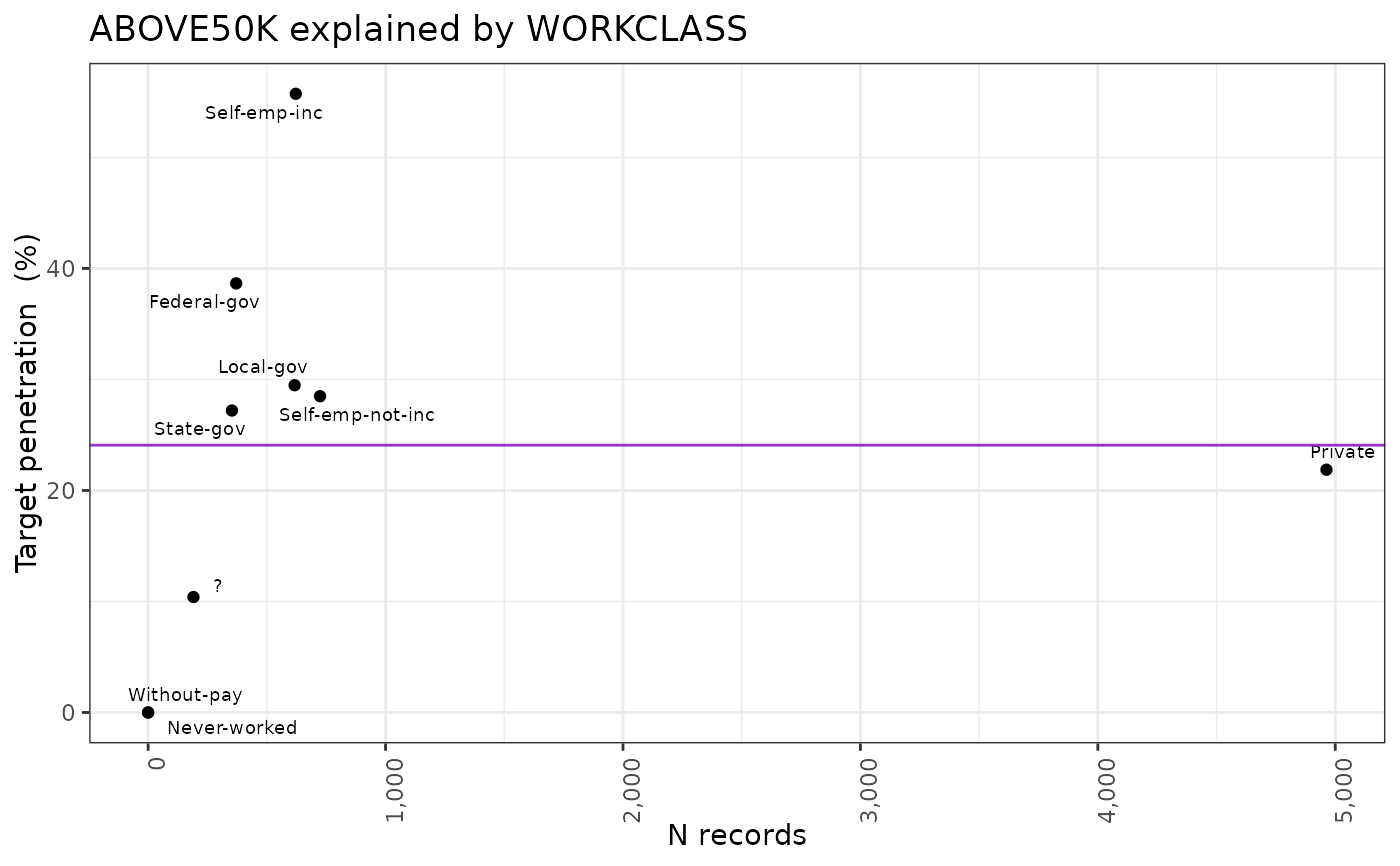
quadrant method for crossvar object, displays explanatory variable categories (or bin) in a quadrant plot crossing category size (N) and target (percentage for binary target or average for continuous target).
This function allows to generate a quadrant graphic on an object of class "crossvar".
Arguments
- x
object of class "crossvar"
- metadata
data.frame - if metadata is loaded in R environment, label of the variables can be used. Default value (NULL) corresponds to no metadata available. The label will be used for the title and the x-axis of the graph.
- max_ncat
maximum number of values/categories that will be displayed ( additional will be collapsed) - default: 15
- print_NA
boolean: whether to display or not the NA possible category (default: TRUE)
- title
either boolean or character. If boolean: do we plot (default generated ) title, if character, provided title will be used
Examples
t <- crossvar(adult,"ABOVE50K","WORKCLASS")
#>
#> INFO:target ABOVE50K detected as type: binary
#> INFO:binary target contains number, automatic chosen level: 1; override using `target_reference_level`
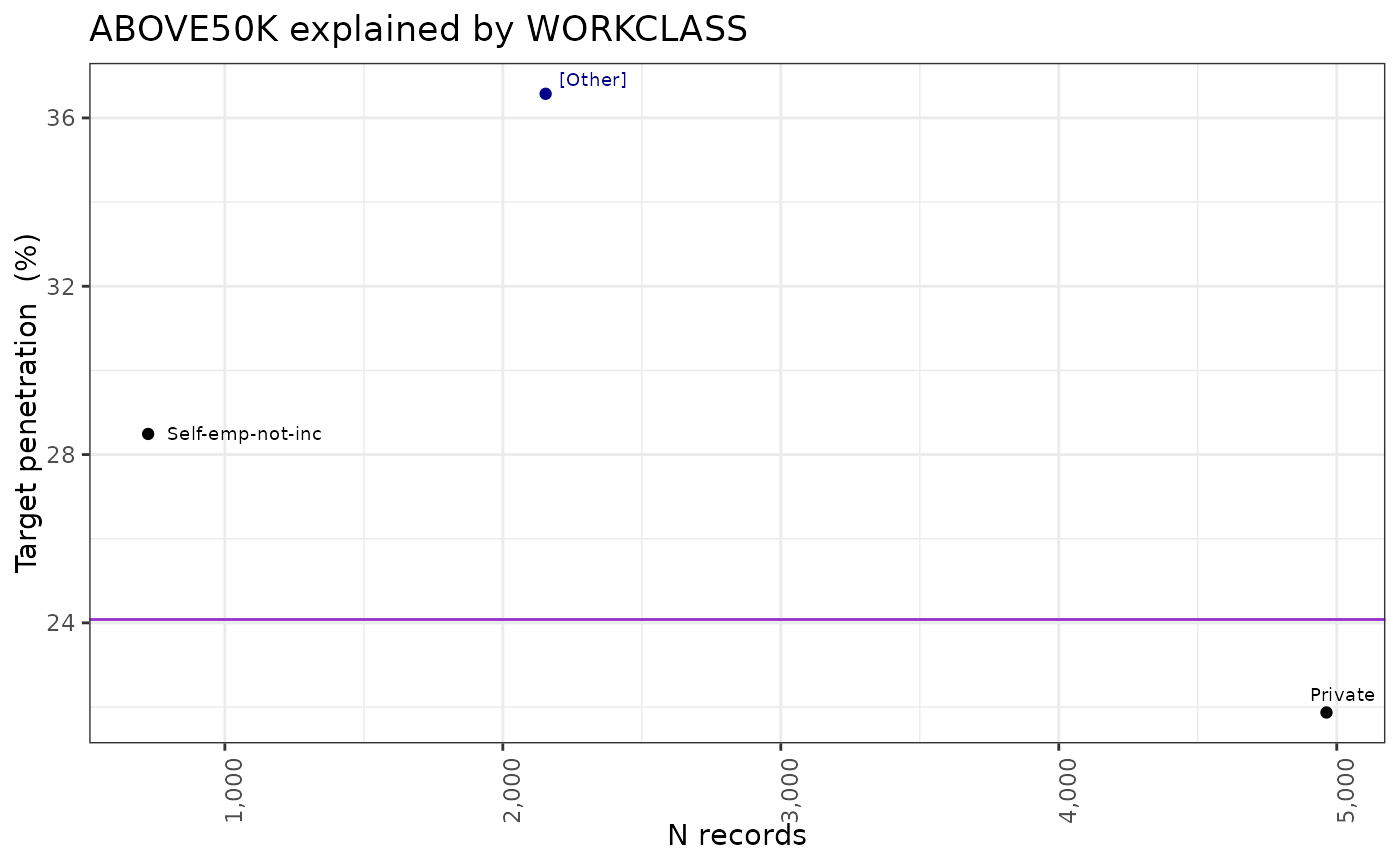
quadrant_plot(t)
 quadrant_plot(t, max_ncat=2)