Data Exploration plots
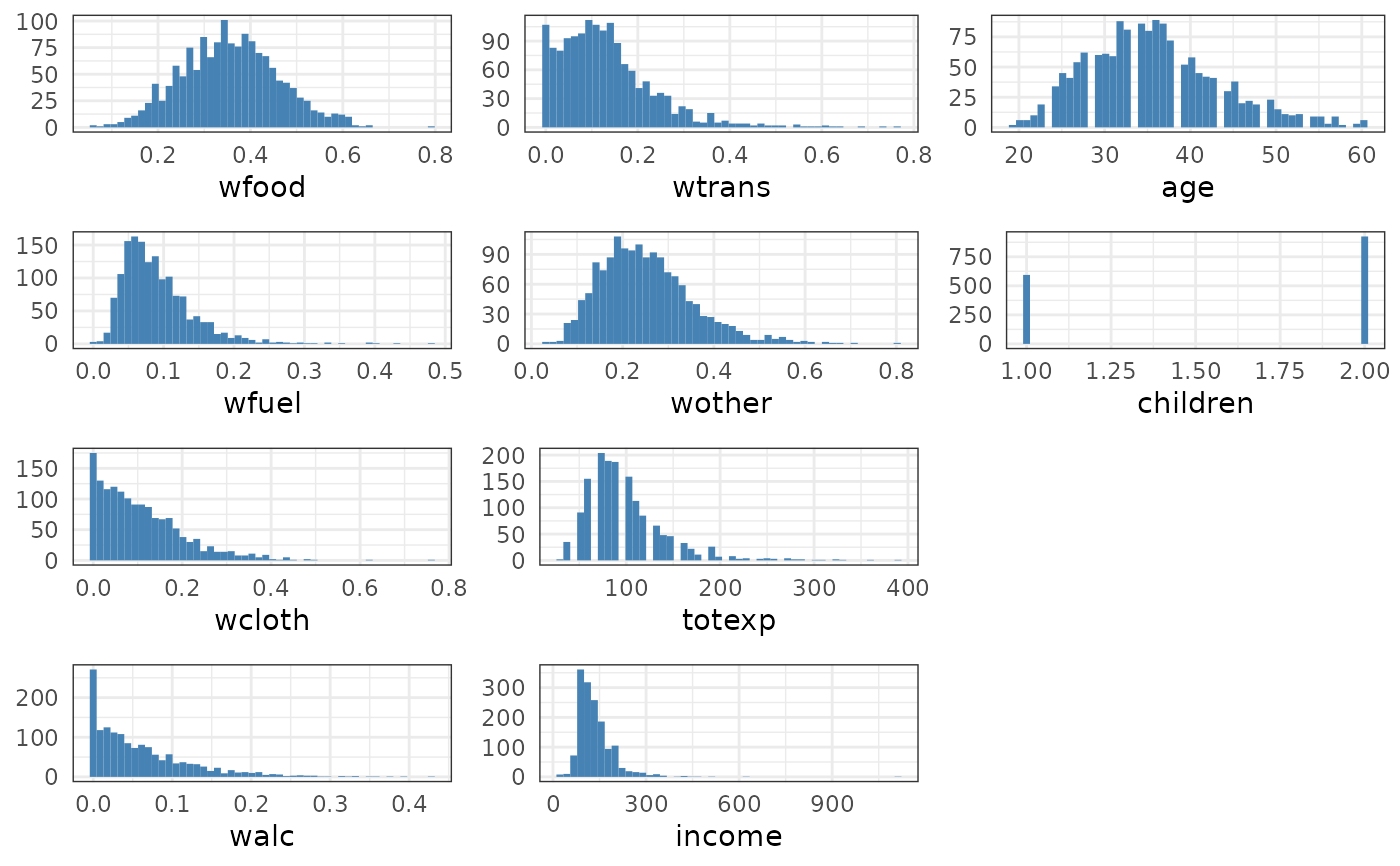
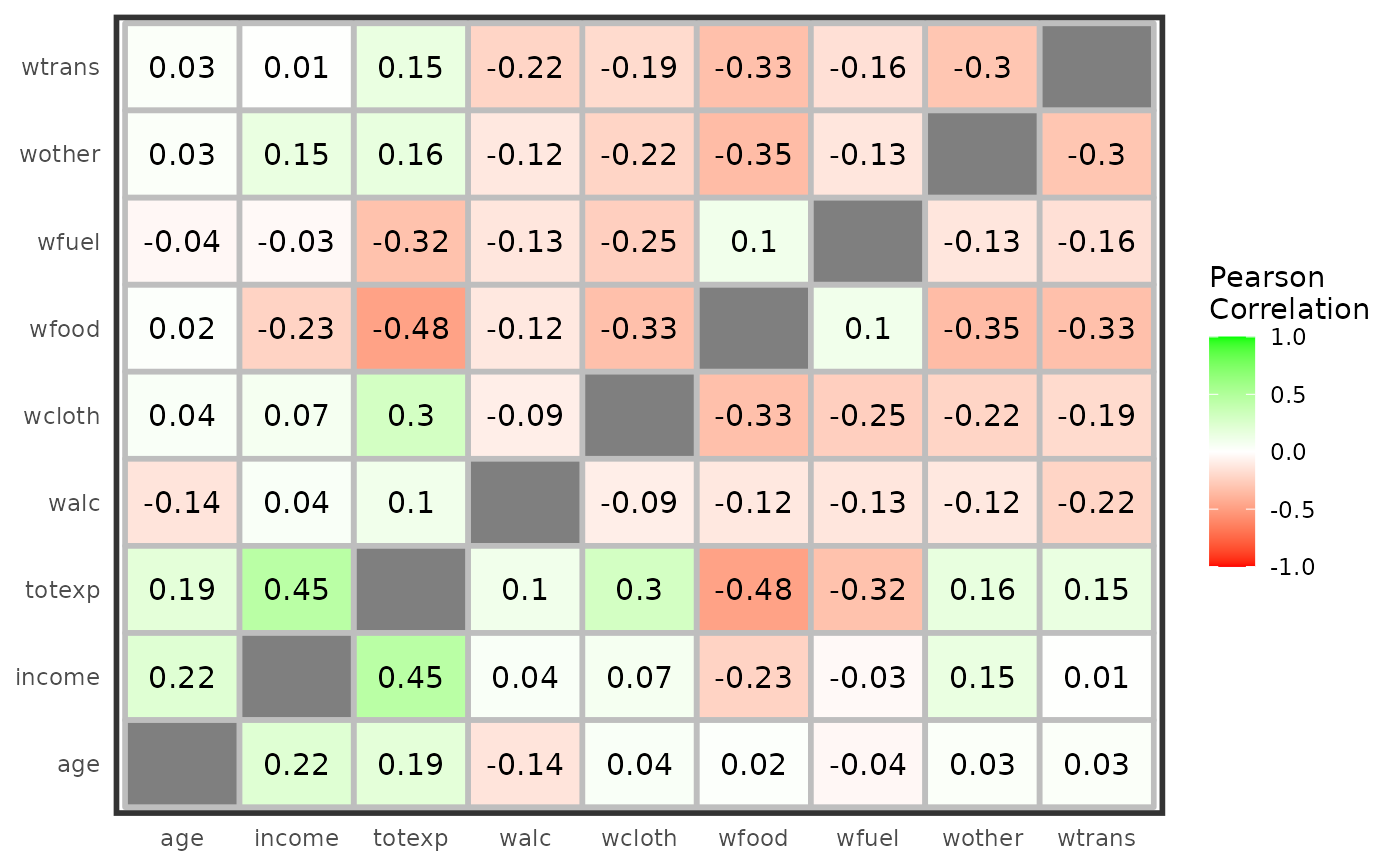
explore.RdThis is a simple function that produced plots that may help you to understand the shape of your dataset. Today, 3 plots are implemented;(1) a small histogram for each features, (2) a correlation matrix and (3) a 2-Dimension Hexbin Frequency.
explore(data, type = "histogram", keep = NULL, drop = NULL, ...)Arguments
- data
is the data frame containing the observations. Each row represents an observation and each variable is stored in one column.
- keep
character vector: names of columns to keep (filter)
- drop
character vector: names of columns to drop (filter)
- ...
is additional arguments to be passed to internal functions. Currently only col.fill and bins for histograms.
Examples
# \dontrun{
explore(BudgetUK, type ="hist")
#> Loading required package: tidyr
 explore(BudgetUK, type ="cor",drop="children")
#> Warning: Removed 9 rows containing missing values (geom_text).
explore(BudgetUK, type ="cor",drop="children")
#> Warning: Removed 9 rows containing missing values (geom_text).
 # }
# }